Sri Lanka’s Presidential Elections: Western Province/Gampaha District – Voters & Demographic Influence
Western Province comprises 3 districts (Colombo, Gampaha & Kalutara)
Gampaha comprises 13 electoral polling divisions. The analysis covers 3 main elections – Presidential, General & Provincial Councils.
Keeping to the official census statistics of 2012 the island’s population stood at 20,359,439 (20m)
5,851,130 (5.8m) or 28.7% of the Islands 20m live in the Western Province.
Colombo District population is 2,323,826 while Gampaha district comes second with 2,298,588 people. The difference is just 25,238 only.
Gampaha is located North-East of Colombo.
The name Gampaha means 5 villages originally referring to Ihalagama, Pahalagama, Medagama, Pattiyagama and Aluthgama. Gampaha was classified as a district in 1978.
Literacy in Gampaha district is the highest in Sri Lanka with 98.5% – Colombo is second with 98%.
Ethnic composition in Gampaha
- Sinhalese in Gampaha have declined from 92% in 1981 to 90.5% in 2012
- Tamils in Gampaha remain 3.5% as in 1981 & 2012
- Muslims have increased in Gampahs from 2.7% in 1982 to 4.2% in 2012
Religious composition in Gampaha
- Buddhists in Gampaha were 71.1% in 1981 / in 2012 Buddhists have increased marginally to 71.3%
- Hindus in Gampaha were 1.9% in 1981 / in 2012 Hindus have increased to 2.3%
- Islam in Gampaha were 3.5% in 1981 / in 2012 Islam adherents have increased to 4.9%
- Catholics in Gampaha were 22.5% in 1981 / in 2012 Catholics have decreased to 19.5%
- Christians in Gampaha were 0.9% in 1981 / in 2012 Christians have increased to 2%
PRESIDENTIAL ELECTIONS IN GAMPAHA DISTRICT
Main 2 contestants at the 7 Presidential Elections held
- 1982 – JR (UNP) / Hector Kobbekaduwa (SLFP)
- 1988 – R Premadasa (UNP) / Sirimavo Bandaranaike (SLFP)
- 1994 – Srima Dissanayake (UNP) / Chandrika Bandaranaike (PA)
- 1999 – Ranil Wikcremasinghe (UNP) / Chandrika Bandaranaike (PA)
- 2005 – Ranil Wikcremasinghe (UNP) / Mahinda Rajapakse (UPFA)
- 2010 – Sarath Fonseka Common Candidate / Mahinda Rajapakse (UPFA)
- 2015 – Maithripala Sirisena Common Candidate / Mahinda Rajapakse (UPFA)
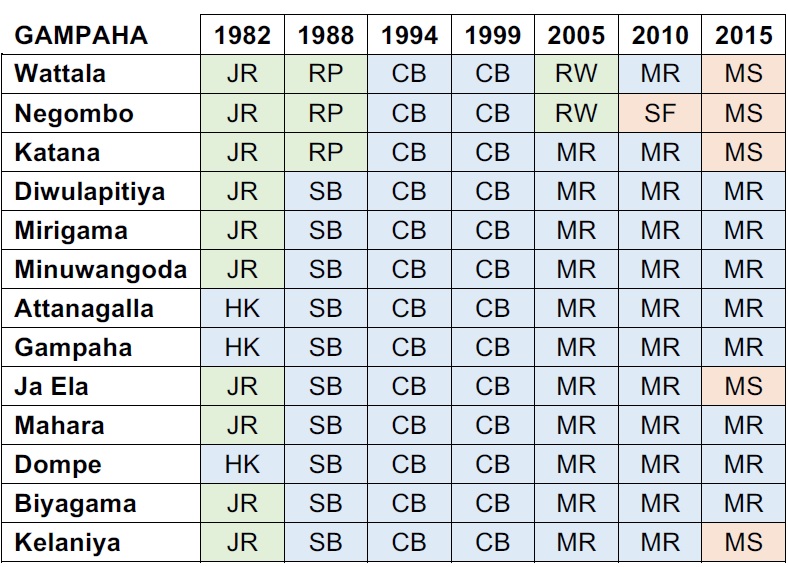
7 Presidential Election Results
JR = JR Jayawardena
RP = R Premadasa
HK = Hector Kobbekaduwa
SB = Sirimavo Bandaranaike
CB = Chandrika Bandaranaike
RW = Ranil Wickremasinghe
MR = Mahinda Rajapakse
SF = Sarath Fonseka
MS = Maithripala Sirisena
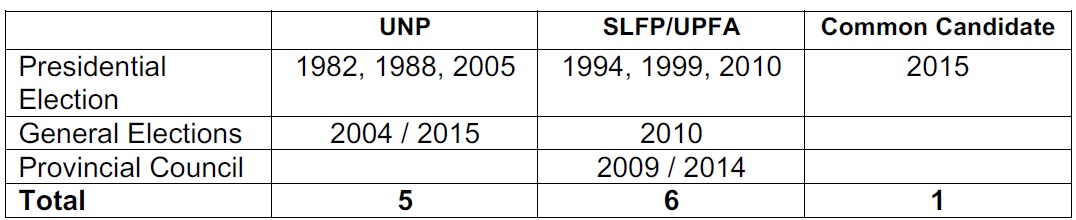
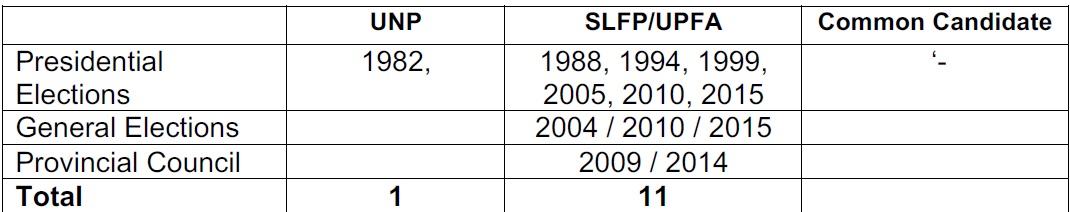
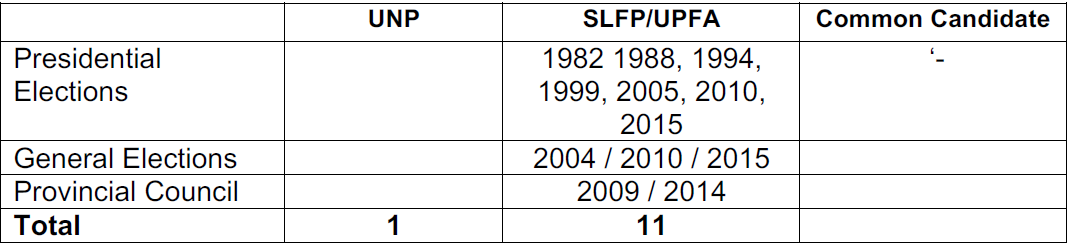
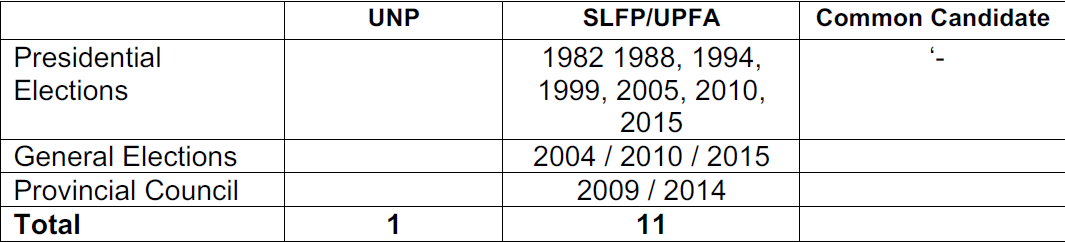
Of the 7 Presidential Elections held in Gampaha District
- UNP has won Once in 1982
- UPFA/SLFP has won 5 times (1988, 1994, 1999, 2005, 2010)
- Common Candidate has won Once in 2015
Out of the 91 times elections has been held since 1982 in the Gampaha District
- The UNP has won 15 – 16.4%
- The SLFP/UPFA has won 70 – 76%
- Common Candidate Fonseka won 1 – 1%
- Common Candidate Sirisena won 5 – 5.4%
- 1982 – JR Jayawardena (UNP) won 10 out of 13 polling divisions
- 1988 – Sirimavo Bandaranaike (SLFP) won 10 out of 13 polling divisions with R Premadasa winning 3
- 1994 – Chandrika Bandaranaike (PA) won all 13 polling divisions
- 1999 – Chandrika Bandaranaike (PA) won all 13 polling divisions
- 2005 – Mahinda Rajapakse (UPFA) won 11 polling divisions while Ranil W (UNP) won 2
- 2010 – Mahinda Rajapakse (UPFA) won 12 polling divisions while Sarath Fonseka Common Candidate won 1
- 2015 – Mahinda Rajapakse won 8 polling divisions with Maithripala Sirisena Common Candidate winning 5
SLFP/UPFA % voting & wins
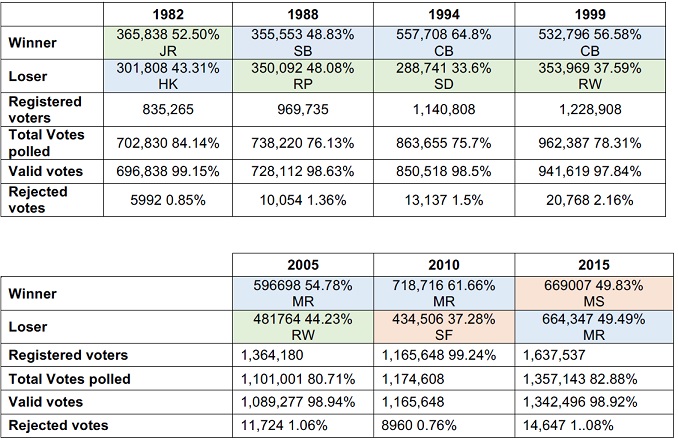
- The majority of votes for the UPFA/SLFP presidential candidate has been at the 1994 Presidential Electionwith CBK winning 557,708 votes or 64.8% of the votes cast.
- The least number of voters voting for the UPFA/SLFP presidential candidate has been at the 1982/1988 Presidential Election & thereafter at the last 2015 Presidential election with only 49% voting for the UPFA presidential candidate
- Out of the 7 Presidential elections held, Gampaha district has voted for the UPFA/SLFP presidential candidate 5 times losing the first & last elections (1982 & 2015)
- In terms of voters – the 2015 has seen a significant reduction in voters going to vote from the 2010 Presidential elections with the difference being 54,369 voters.
- 54,369 of the UPFA/SLFP vote base did not go to vote in 2015 – why?
UNP/Common Candidate % voting & wins
- The majority of votes for the UNP presidential candidate has been at the 1982 Presidential election with JR Jayawardena winning 52.5% of the votes cast. However, in terms of numbers going to vote the highest has been for the 2015 Common Candidate Maithripala Sirisena securing 669,007 votes.
- The least number of voters voting for the UNP presidential candidate has been at the 1994 Presidential election with UNP’s presidential candidate Srima Dissanayake securing only 288,741 votes which is 33.6% of the votes cast.
- Out of the 7 Presidential elections held, Gampaha district has voted for the UNP candidate only Once & the Common Candidate Once (the 1st the last election)
- In terms of voters – from 1982 to 1994 number of UNPers voting have reduced, 1999 saw a rise but decreased again in 2010 but rose phenomenally in 2015.
- How did UNP vote base in Gampaha District shoot up from 434,506 voters in 2010 to 669,007 in 2015 – an increase of 234,501 voters?
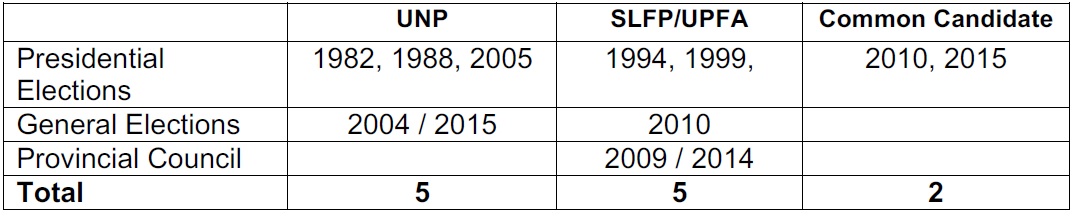
Wattala Electoral Polling Division
Wattala – Presidential Elections
The highest percentage of voters cast their votes in 1982, though in terms of voters the most voted in 2015 with 56,541 going to vote. Whereas only 39,316 voters went to vote in 2010, in 2015, 56,541 voters voted – an increase of 17,225 voters.
Wattala – General Elections
2004 – 34,041 / 50.18% (UNP)
2010 – 31,444 / 49.55% (UPFA)
2015 – 51,011 / 58.29% (UNP)
The 3 General elections held in 2004, 2010, 2015 – UNP has won twice & vote base has increased by 16970 voters since 2004 election.
Wattala – Provincial Council Elections 2009 /2014
UPFA won all 13 polling divisions in Gampaha District at the 2009 & 2014 provincial council elections.
UPFA votes has increased from 36,467 in 2009 to 36,650 in 2014
UNP votes have reduced from 22,657 in 2009 to 22,642 in 2014
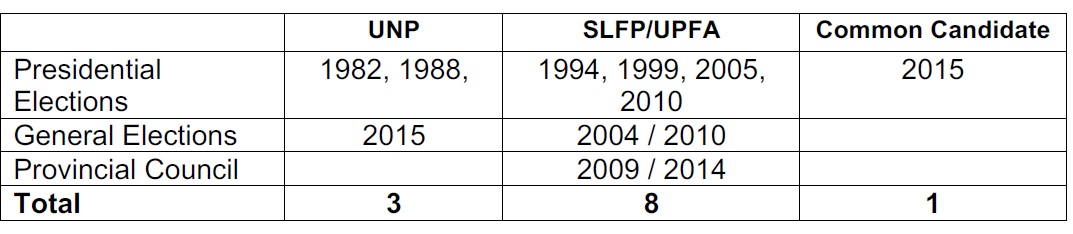
Negombo Electoral Polling Division
Negombo – Presidential Elections
The highest percentage of voters cast their votes in 1982 with 67.4%. In terms of numbers the most voted in 2015 with 53,331 going to vote. Whereas only 36,669 went to vote in 2010, in 2015, 53,331 voters voted an increase of 16,662. In 2010 & 2015 Negombo voted for the Common Candidates while in 2005 Negombo voted for the UNP Presidential Candidate.
Negombo – General Elections
2004 – 33,709 / 55.14% (UNP)
2010 – 26,076 48.25% (UPFA)
2015 – 48,517 / 67.60% (UNP)
The 3 General elections held in 2004, 2010, 2015 – UNP has won twice & vote base has increased by 14808 voters since 2004 election.
Negombo – Provincial Council Elections 2009/2014
UPFA won all 13 polling divisions in Gampaha District at the 2009 & 2014 provincial council elections.
UPFA votes have reduced from 32,475 in 2009 to 28,763 in 2014
UNP votes have increased from 17,823 to 22,687 in 2014
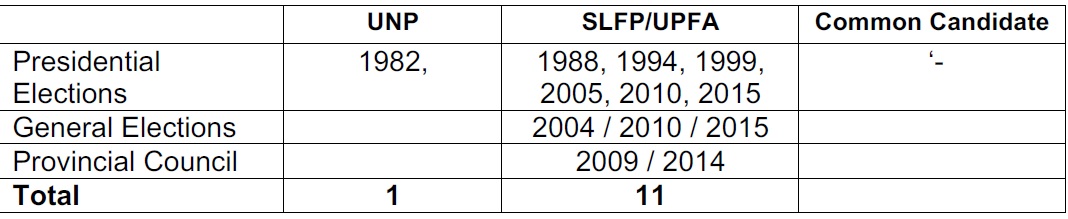
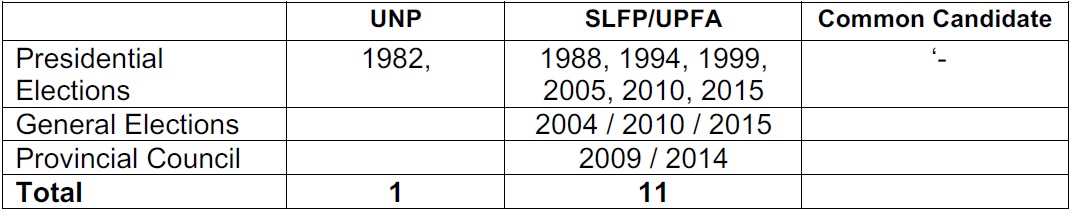
Katana Electoral Polling Division
Katana – Presidential Elections
The highest percentage of voters cast their votes in 1994 with 62.8%. In terms of numbers the most voted in 2015 with 58,507 going to vote. Katana vote base for the UNP has seen only a small increase from 26,504 in 1982 to 28,760 in 1988. Katana has not voted for the UNP since 1988 though it voted for the UNP nominated Common Candidate in 2015. Katana vote base for UPFA/SLFP has been increasing since 1994 (45,607 voters) to 2010 59,558 voters. An increase of 13,951 voters
Katana – General Elections
2004 – 41,823 / 51.52% (UPFA)
2010 – 49,766 / 63.32% (UPFA)
2015 – 50,393 / 48.79% (UNP)
The 3 General elections held in 2004, 2010, 2015 – UPFA has won twice in 2004 & 2010 (vote base seen significantly declining)
Katana voted for UNP in 2015. UNP votes in 2010 General Elections was 22,919 / 29.16% & it is interesting to see how UNP Katana vote base increased to 50,393 in 2015.
Katana – Provincial Council Elections 2009/2014
UPFA won all 13 polling divisions in Gampaha District at the 2009 & 2014 provincial council elections.
UPFA votes have reduced from 53,286 in 2009 to 50,857 in 2014
UNP votes have increased from 21,921 in 2009 to 22,491 in 2014
Diwulapitiya Electoral Polling Division
Diwulapitiya – Presidential Elections
The highest percentage of voters cast their votes in 2010 with 62.03%. In terms of numbers the most voted in 2010 with 48,149 going to vote.
Divulapitiya has voted for UNP only once at the 1982 Presidential Elections with 25,974 (50.6% voting).
Divulapitiya vote base for UPFA/SLFP has been increasing from 1988 (25,857 voters) to 2010 (48,149 voters) but decreased to 45,813 voters in 2015. UPFA/SLFP must wonder why its vote base decreased by 2336 voters.
Diwulapitiya – General Elections
2004 – 34,257 / 51.25% (UPFA)
2010 – 38,957 64.74% (UPFA)
2015 – 38,471 49.01% (UPFA)
The 3 General elections held in 2004, 2010, 2015 – UPFA has all 3 polling divisions. However it is noteworthy that the UPFA vote base is declining from 2010 to 2015 and reasons should be addressed.
Divulapitiya – Provincial Council Elections 2009/2014
UPFA won all 13 polling divisions in Gampaha District at the 2009 & 2014 provincial council elections.
UPFA votes have reduced from 42,097 in 2009 to 40,666 in 2014
UNP votes have increased from 17,387 in 2009 to 17,835 in 2014
Mirigama Electoral Polling Division
Mirigama – Presidential Elections
The highest percentage of voters cast their votes in 2010 with 63.65%. In terms of numbers the most voted in 2010 with 54,697 going to vote.
Mirigama has voted for UNP only once at the 1982 Presidential Elections with 30,289 (52.2%voting).
Mirigama vote base for UPFA/SLFP has been increasing from 1988 (27,712 voters) to 2010 (54,697 voters) but decreased to 51,244 voters in 2015. UPFA/SLFP must wonder why its vote base decreased by 3453 voters.
Mirigama – General Elections
2004 – 39,853 / 53.31% (UPFA)
2010 – 45,428 / 66.66% (UPFA)
2015 – 41,014 / 46.78% (UPFA)
The 3 General elections held in 2004, 2010, 2015 – UPFA has all 3 polling divisions. However it is noteworthy that the UPFA vote base is declining from 2010 to 2015 and reasons should be addressed.
Mirigama – Provincial Council Elections 2009/2014
UPFA won all 13 polling divisions in Gampaha District at the 2009 & 2014 provincial council elections.
UPFA votes have reduced from 45,740 in 2009 to 43,418 in 2014
UNP votes have reduced from 17,728 in 2009 to 16,957 in 2014
Minuwangoda Electoral Polling Division
Minuwangoda – Presidential Elections
The highest percentage of voters cast their votes in 1994 with 63%. In terms of numbers the most voted in 2010 with 60,318 going to vote.
Minuwangoda has voted for UNP only once at the 1982 Presidential Elections with 29,672 (51.2% voting).
Minuwangoda vote base for UPFA/SLFP has been increasing from 1988 (29,751 voters) to 2010 (60,318 voters) but decreased to 54,929 voters in 2015. UPFA/SLFP must wonder why its vote base decreased by 5389 voters.
Minuwangoda – General Elections
2004 – 41,026 / 51.47% (UPFA)
2010 – 49,033 / 66.32% (UPFA)
2015 – 45,898 / 47.16% (UPFA)
The 3 General elections held in 2004, 2010, 2015 – UPFA has all 3 polling divisions. However it is noteworthy that the UPFA vote base is declining from 2010 to 2015 and reasons should be addressed.
Minuwangoda – Provincial Council Elections 2009/2014
UPFA won all 13 polling divisions in Gampaha District at the 2009 & 2014 provincial council elections.
UPFA votes have reduced from 55,692 in 2009 to 51,035 in 2014
UNP votes have increased from 17,466 in 2009 to 18,205 in 2014
Attanagalla Electoral Polling Division
Attanagalla – Presidential Elections
The highest percentage of voters cast their votes in 1994 with 73.6%. In terms of numbers the most voted in 2010 with 61,337 going to vote.
Attanagalla has NOT VOTED for UNP at any of the 7 Presidential Elections held since 1982
Attanagalla vote base for UPFA/SLFP has been increasing from 1982 (31,495 voters) to 2010 (61,337 voters) but decreased to 54,777 voters in 2015.
UPFA/SLFP must wonder why its vote base decreased by 6560 voters.
Attanagalla – General Elections
2004 – 45,529 / 57.52% (UFPA)
2010 – 51,172 / 70.15% (UPFA)
2015 – 44,926 / 47.29% (UPFA)
The 3 General elections held in 2004, 2010, 2015 – UPFA has all 3 polling divisions. However it is noteworthy that the UPFA vote base has significantly declined from 2010 to 2015 and reasons should be addressed.
Attanagalle – Provincial Council Elections 2009/2014
UPFA won all 13 polling divisions in Gampaha District at the 2009 & 2014 provincial council elections.
UPFA votes have reduced from 51,661 in 2009 to 50,735 in 2014
UNP votes have increased from 12,763 in 2009 to 13,667 in 2014
Gampaha Electoral Polling Division
Gampaha – Presidential Elections
The highest percentage of voters cast their votes in 1994 with 70.8% In terms of numbers the most voted in 2010 with 71,811 going to vote.
Gampaha has NOT VOTED for UNP at any of the 7 Presidential Elections held since 1982
Gampaha vote base for UPFA/SLFP has been increasing from 1982 (28,532 voters) to 2010 (71,811 voters) but decreased to 63,962 voters in 2015.
UPFA/SLFP must wonder why its vote base decreased by 7849 voters.
Gampaha – General Elections
2004 – 51,944 / 58.63% (UPFA)
2010 – 58,268 69.56% (UPFA)
2015 – 53,901 50.32% (UPFA)
The 3 General elections held in 2004, 2010, 2015 – UPFA has all 3 polling divisions. However, it is noteworthy that the UPFA vote base has declined from 2010 to 2015 and reasons should be addressed.
Gampaha – Provincial Council Elections 2009/2014
UPFA won all 13 polling divisions in Gampaha District at the 2009 & 2014 provincial council elections.
UPFA votes have reduced greatly from 60,210 in 2009 to 50,227 in 2014
UNP votes have reduced from 16,968 in 2009 to 16,633 in 2014
Ja-Ela Electoral Polling Division
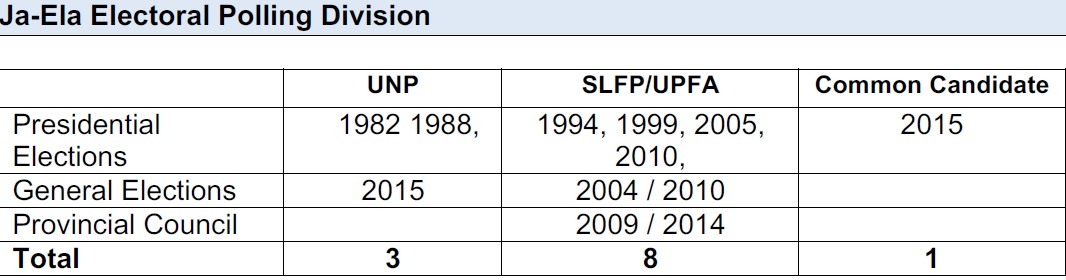
Ja-Ela – Presidential Elections
The highest percentage of voters cast their votes in 1994 with 63.8%. In terms of numbers the most voted in 2015 with 58,669 voting for the Common Candidate Maithripala Sirisena.
Ja-Ela has voted for UNP in 1982 (32,420 – 58.2%) & 1988 (30,021 – 52.54%) voters going to vote.
Ja-Ela vote base for UPFA/SLFP has been increasing from 1994 (44,166 voters) to 2010 (56,726 voters) Ja-Ela voted for UPFA/SLFP candidates from 1994 to 2010.
UPFA/SLFP must wonder why its vote base decided to vote for the Common Candidate in 2015.
Ja-Ela – General Elections
2004 – 42,453 / 50.65% (UPFA)
2010 – 43,920 / 56.80% (UPFA)
2015 – 51,807 / 49.81% (UNP)
The 3 General elections held in 2004, 2010, 2015 – UPFA has won twice in 2004 & 2010 (vote base seen declining)
Ja-Ela voted for UNP in 2015. UNP votes in 2010 General Elections was 26,397 / 34.14%
& it is interesting to see how UNP Ja-Ela vote base increased to 51,807 in 2015 (an increase by 25,410.
Ja-Ela – Provincial Council Elections 2009/2014
UPFA won all 13 polling divisions in Gampaha District at the 2009 & 2014 provincial council elections.
UPFA votes have reduced from 50,015 in 2009 to 46,286 in 2014
UNP votes have increased from 23,430 in 2009 to 25,364 in 2014
Mahara Electoral Polling Division
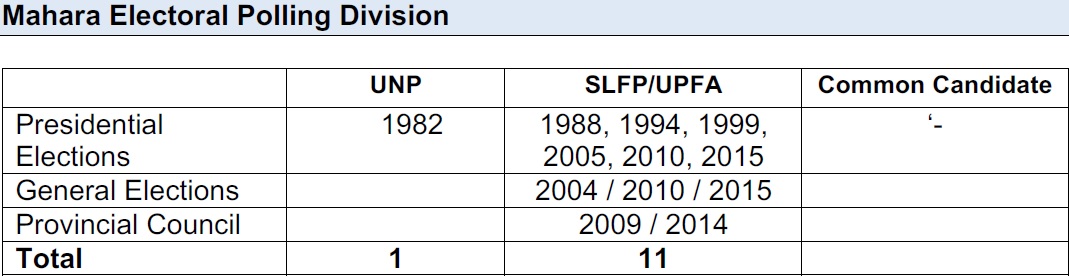
Mahara – Presidential Elections
The highest percentage of voters cast their votes in 1994 with 67%. In terms of numbers the most voted in 2010 with 69,085.
Mahara has voted for UNP only in 1982 (25,853 – 48.0%)
Mahara vote base for UPFA/SLFP has been increasing from 1988 (30,305 voters) to 2010 (69,085 voters)
UPFA/SLFP must wonder why its vote base has declined in 2015 with 4771 voting less than in 2010.
Mahara – General Elections
2004 – 47,558 / 54.97% (UPFA)
2010 – 55,327 / 66.65% (UPFA)
2015 – 54,362 / 49.66% (UPFA)
The 3 General elections held in 2004, 2010, 2015 – UPFA has all 3 polling divisions. However, it is noteworthy that the UPFA vote base has declined from 2010 to 2015 and reasons should be addressed.
Mahara – Provincial Council Elections 2009/2014
UPFA won all 13 polling divisions in Gampaha District at the 2009 & 2014 provincial council elections.
UPFA votes have reduced from 59,679 in 2009 to 55,286 in 2014
UNP votes have reduced from 18,163 in 2009 to 17,872 in 2014
Dompe Electoral Polling Division

Dompe – Presidential Elections
The highest percentage of voters cast their votes in 2010 with 69.79%. In terms of numbers the most voted in 2010 with 56,758.
Dompe has NOT voted for UNP at any of the 7 Presidential Elections held since 1982
Dompe vote base for UPFA/SLFP has been increasing from 1982 (27,508 voters) to 2010 (56,758 voters) but declined in 2015 to 54,714
UPFA/SLFP must wonder why its vote base has declined in 2015 with 2004 voting less than in 2010.
Dompe – General Elections
2004 – 40,327 / 57.70% (UPFA)
2010 – 46,356 / 71.94% (UPFA)
2015 – 44,925 / 52.52% (UPFA)
The 3 General elections held in 2004, 2010, 2015 – UPFA has all 3 polling divisions. However, it is noteworthy that the UPFA vote base has significantly declined from 2010 to 2015 and reasons should be addressed.
Dompe – Provincial Council Elections 2009/2014
UPFA won all 13 polling divisions in Gampaha District at the 2009 & 2014 provincial council elections.
UPFA votes have reduced from 48,383 in 2009 to 44,256 in 2014
UNP votes have increased from 14,315 in 2009 to 18,277 in 2014
Biyagama Electoral Polling Division
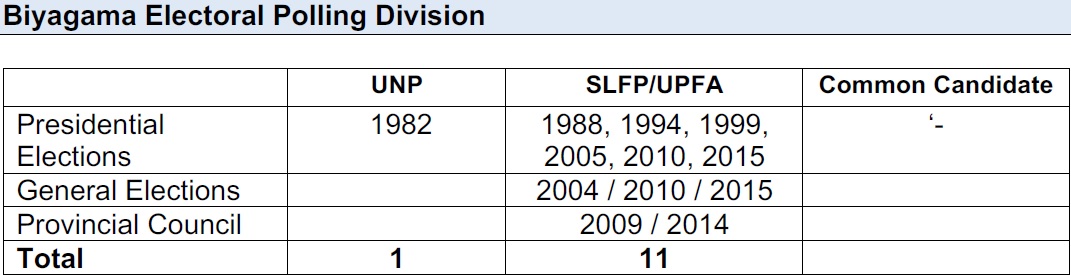
Biyagama – Presidential Elections
The highest percentage of voters cast their votes in 1994 with 63.9%. In terms of numbers the most voted in 2010 with 52,066.
Biyagama has voted for UNP only in 1982
Biyagama vote base for UPFA/SLFP has been increasing from 1982 (23,930 voters) to 2010 (52,066 voters) but declined in 2015 to 50,173
UPFA/SLFP must wonder why its vote base has declined in 2015 with 1893 voting less than in 2010.
Biyagama – General Elections
2004 – 34,502 / 48.40% (UPFA)
2010 – 41,478 / 61.74% (UPFA)
2015 – 42,759 / 46.67% (UPFA)
The 3 General elections held in 2004, 2010, 2015 – UPFA has all 3 polling divisions. However, it is noteworthy that the UPFA vote base has declined from 2010 to 2015 and reasons should be addressed.
Biyagama – Provincial Council Elections 2009/2014
UPFA won all 13 polling divisions in Gampaha District at the 2009 & 2014 provincial council elections.
UPFA votes have reduced from 45,061 in 2009 to 40,473 in 2014
UNP votes have increased from 18,241 in 2009 to 19,859 in 2014
Kelaniya Electoral Polling Division
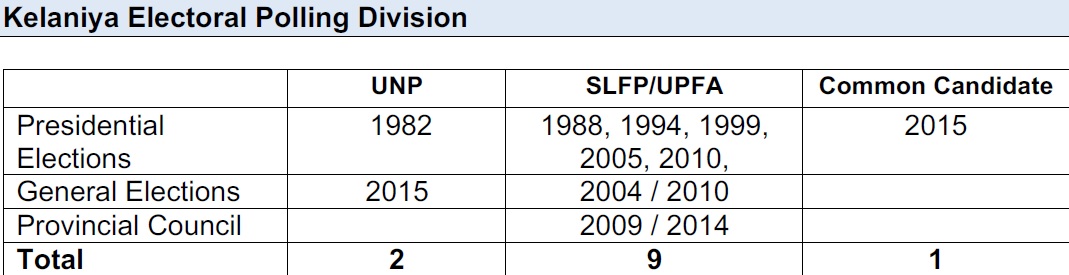
Kelaniya – Presidential Elections
The highest percentage of voters cast their votes in 1994 with 64.5%. In terms of numbers the most voted in 2015 with 37,884 for the Common Candidate.
Kelaniya has voted for UNP only in 1982
Kelaniya vote base for UPFA/SLFP has been increasing from 1982 (22,877 voters) to 1994 (35,601) but declined in 1999 to 30,947 and then increased in 2005 to 33,179 & further increased to 36,242 in 2010 but in 2015 the Common Candidate won Kelaniya with 37,884 votes.
UPFA/SLFP must wonder why its vote base decided not to vote for the UPFA Presidential Candidate in 2015.
Kelaniya – General Elections
2004 – 25,774 / 43.87% (UPFA)
2010 – 30,276 / 57.91% (UPFA)
2015 – 31,501 / 47.09% (UNP)
The 3 General elections held in 2004, 2010, 2015 – UPFA has won twice in 2004 & 2010 (vote base seen increasing)
Kelaniya voted for UNP in 2015. UNP votes in 2010 General Elections was 16,479 / 31.52%
& it is interesting to see how UNP Kelaniya vote base increased to 31,501 / 47.09% in 2015 (an increase by 15,022).
Kelaniya – Provincial Council Elections 2009/2014
UPFA won all 13 polling divisions in Gampaha District at the 2009 & 2014 provincial council elections.
UPFA votes have reduced from 32,388 in 2009 to 28,200 in 2014
UNP votes have reduced from 14,694 in 2009 to 13,030 in 2014
General Elections:
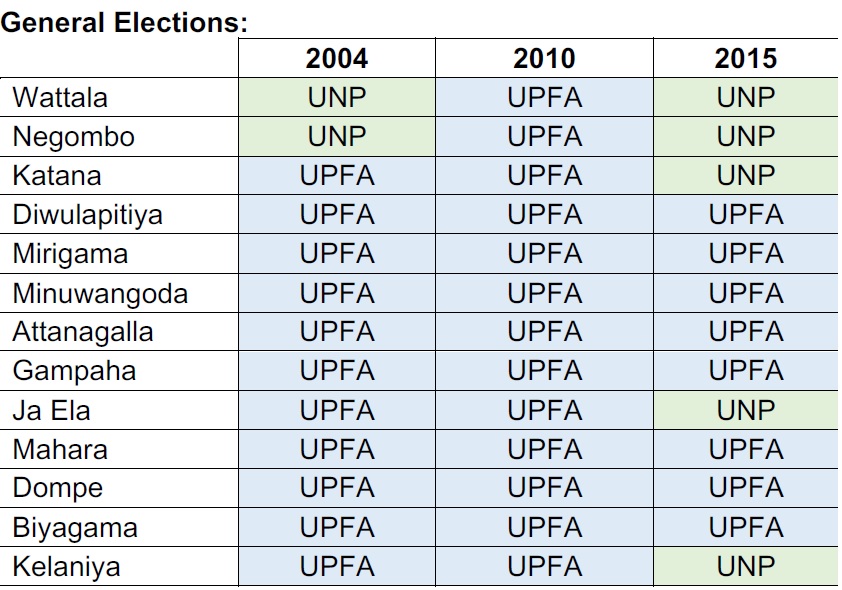
While UPFA won all 13 polling divisions in the Gampaha district in 2010 bettering their performance from the 2004 general elections where Wattala & Negombo went to UNP, at the 2015 General Elections the UNP were able to secure wins in 5 of the 13 polling divisions of Wattala, Negombo, Katana, Ja-Ela and Kelaniya. Noteworthy that in both 2004 and 2015 Wattala & Negombo have voted for UNP.
UPFA needs to address decline in voters in Diwulapitiya, Mirigama, Minuwangoda, Gampaha, Mahara, Biyagama
UPFA needs to address major voter decline in Attanagalla, Dompe
UNP secured wins in Wattala & Negombo in 2004 & 2015 & vote base has increased in both. In Katana & Ja-Ela, UNP vote base has increased by over 50,000 voters in both polling divisions while UNP won Kelaniya for the first time having lost the 2004 & 2010 General Elections.
Analysis of UPFA Provincial Council Results of 2009/2014
UPFA has won all 13 polling divisions of Gampaha in both provincial council elections held in 2009 & 2014,
UPFA secured 624,530 69.07% in 2009 & 582,668 57.98% in 2014
UPFA vote base has reduced by 41,864 voters. This is a figure that UPFA must draw attention towards.
UPFA votes have increase very marginally in Wattala with 183 vote increase while in all other 12 polling divisions UPFA vote base has reduced. In Gampaha polling division 9983 have voted less than they did in 2009.
Analysis of UNP Provincial Council Results of 2009/2014
UNP secured 236,256 26.13% in 2009 / UNP secured 249,220 24.80% in 2014
UNP votes have increased by 12,964 from 2009 to 2014
UNP votes have reduced in Wattala, Mirigama, Gampaha, Mahara & Kelaniya
UNP votes have increased in Negombo, Katana, Diwulapitiya, Minuwangoda, Attanagalla, Ja-Ela, Dompe & Biyagama
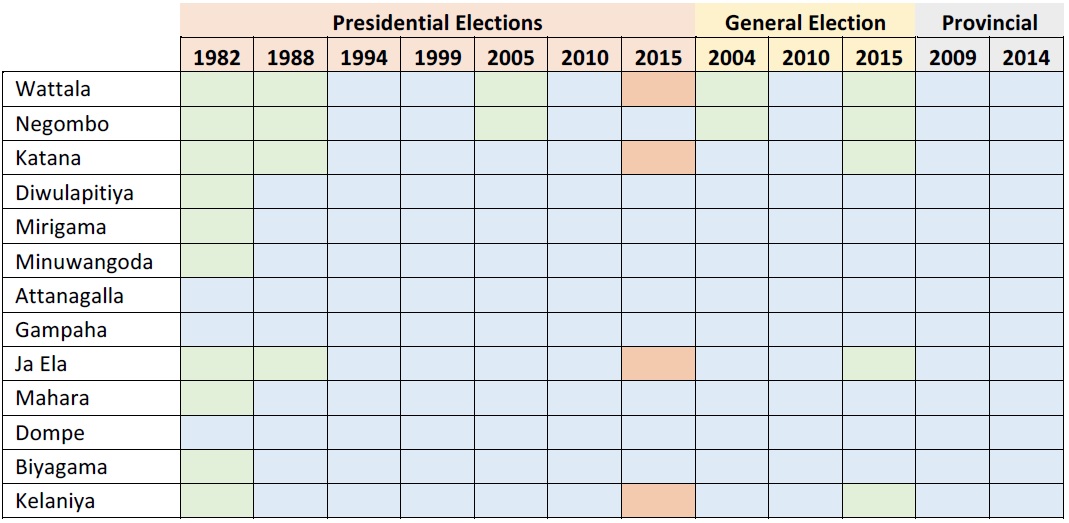
Breakdown of how Gampaha has voted at the 3 elections (Presidential – General – Provincial/ 12 main elections) from 1982 to 2015
Wattala, Katana, Ja-Ela & Kelaniya voted for the Common Candidate at the 2015 Presidential Elections.
Of the 13 polling divisions Wattala & Negombo have voted for UNP, 5 out of the 12 elections held while Katana & Ja-Ela have voted for UNP thrice & Kelaniya has voted for UNP twice.
Diwulapitiya, Mirigama, Minuwangoda, Mahara & Biyagama have voted UNP only in 1982 & have been voting for SLFP/UPFA though voters have reduced.
2 elections were held in 2015 (Presidential & General) at the Presidential Election the Common Candidate won in Wattala, Negombo, Ja-Ela & Kelaniya while the UNP won Wattala, Negombo, Katana, Ja-Ela, Kelaniya which shows that the UNP voters had all voted for the common candidate in January 2015.
Negombo that did not vote for the Common Candidate but voted for the UPFA Presidential Candidate in 2015 January Presidential Election voted for the UNP at the August General Elections in 2015.
Shenali D Waduge