Sri Lanka’s Presidential Elections: Western Province/Kalutara District – Voters & Demographic Influence
Western Province comprises 3 districts (Colombo, Gampaha & Kalutara)
Kalutara comprises 8 electoral polling divisions.
The analysis covers 3 main elections – Presidential, General & Provincial Councils.
Keeping to the official census statistics of 2012 the island’s population stood at 20,359,439 (20m)
- 5,851,130 (5.8m) or 28.7% of the Islands 20m live in the Western Province.
- Colombo District population is 2,323,826
- Gampaha district comes second with 2,298,588 people.
- Kalutara has an area of 4 Sq Km with a population of 1,217,260 as per 2012 census.
http://www.statistics.gov.lk/PopHouSat/CPH2011/index.php?fileName=pop42&gp=Activities&tpl=3
Kalutara District is located in the south west of Sri Lanka. Kalutara is bounded north by Colombo District, East by Rathnapura district and south by Galle district and West by the ocean.
Literacy in Kalutara is 97.8%.
Literacy in Gampaha district is the highest in Sri Lanka with 98.5%
Colombo is second with 98%.
Ethnic composition in Kalutara
Whereas both Tamils & Muslims have increased in Kalutara district the Sinhalese have declined.
- Sinhalese in Kalutara have declined from 87% in 1982 to 86% in 2012
- Tamils in Kalutara have increased from 1.2% in 1981 to 1.9% in 2012
- Muslims in Kalutara have increased from 7.4% in 1981 to 9.3% in 2012
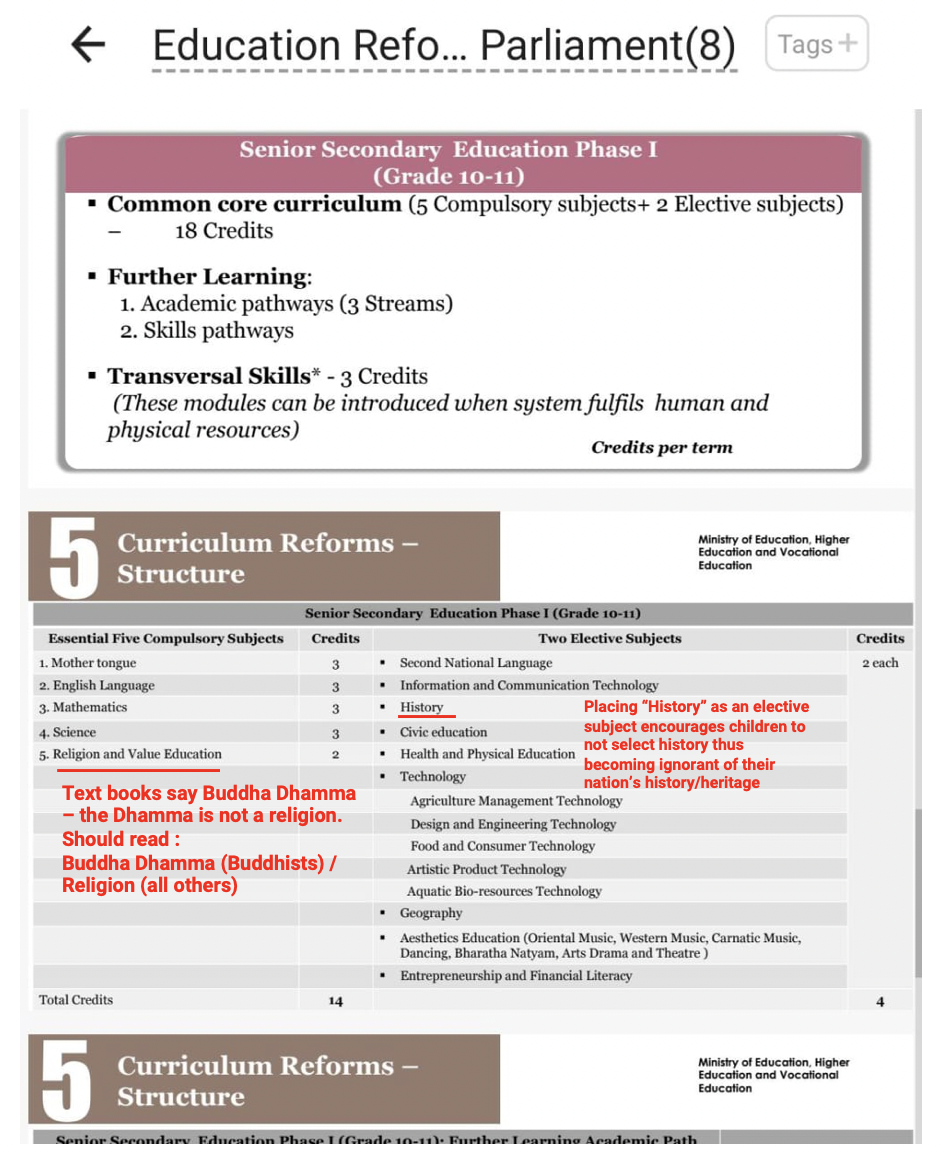
Religious composition in Kalutara
- Buddhists in Kalutara were 84.3% in 1981 / in 2012 Buddhists have reduced to 83.4%
- Hindus in Kalutara were 4.5% in 1981 / in 2012 Hindus have reduced to 3.2%
- Islam in Kalutara were 7.5% in 1981 / in 2012 Islam adherents have increased to 9.4% (an increase of 1.9%)
- Catholics in Kalutara remain 3.3% from 1981 to 2012.
- Christians in Kalutara were 0.3% in 1981 / in 2012 Christians have increased to 0.7%
Buddhists, Hindus have reduced in Kalutara, but Islam & Christians have increased & Catholics remain the same.
PRESIDENTIAL ELECTIONS IN KALUTARA DISTRICT
Main 2 contestants at the 7 Presidential Elections held
- 1982 – JR (UNP) / Hector Kobbekaduwa (SLFP)
- 1988 – R Premadasa (UNP) / Sirimavo Bandaranaike (SLFP)
- 1994 – Srima Dissanayake (UNP) / Chandrika Bandaranaike (PA)
- 1999 – Ranil Wikcremasinghe (UNP) / Chandrika Bandaranaike (PA)
- 2005 – Ranil Wikcremasinghe (UNP) / Mahinda Rajapakse (UPFA)
- 2010 – Sarath Fonseka Common Candidate / Mahinda Rajapakse (UPFA)
- 2015 – Maithripala Sirisena Common Candidate / Mahinda Rajapakse (UPFA)
7 Presidential Election Results contestants
JR = JR Jayawardena
RP = R Premadasa
HK = Hector Kobbekaduwa
SB = Sirimavo Bandaranaike
CB = Chandrika Bandaranaike
RW = Ranil Wickremasinghe
MR = Mahinda Rajapakse
SF = Sarath Fonseka
MS = Maithripala Sirisena
Kalutara District comprises 8 polling divisions
- Panadura
- Bandaragama
- Horana
- Bulathsinhala
- Matugama
- Kalutara
- Beruwela
- Agalawatte
Of the 7 Presidential Elections held in Kalutara District
- UNP has won Once in 1982
- UPFA/SLFP has won 6 times (1988, 1994, 1999, 2005, 2010, 2015)
- Only Bulathsinhala & Kalutara town voted for UNP in 1988
- Only Panadura & Beruwela voted for the Common Candidate in 2015
Of the 7 Presidential elections in Kalutara district since 1982 in the 8 polling divisions held
- The UNP has won 10
- The SLFP/UPFA has won 44
- Common Candidate Fonseka won 1
- Common Candidate Sirisena won 1
- 1982 – JR Jayawardena (UNP) won all 8 polling divisions
- 1988 – Sirimavo Bandaranaike (SLFP) won 6 out of 8 polling divisions with R Premadasa winning 2
- 1994 – Chandrika Bandaranaike (PA) won all 8 polling divisions
- 1999 – Chandrika Bandaranaike (PA) won all 8 polling divisions
- 2005 – Mahinda Rajapakse (UPFA) won all 8 polling divisions
- 2010 – Mahinda Rajapakse (UPFA) won all 8 polling divisions
- 2015 – Mahinda Rajapakse won 6 polling divisions with Maithripala Sirisena Common Candidate winning 2

We will examine how Kalutara District has voted at
- 7 Presidential Elections
- 3 General Elections
- 2 Provincial Council Elections
Election Dates
1982 Presidential Election – 20th Oct 1982
1988 Presidential Election – 19th Dec 1988
1994 Presidential Election – 9th Nov 1994
1999 Presidential Election – 21st Dec 1999
2005 Presidential Election – 17th Nov 2005
2010 Presidential Election – 26th Jan 2010
2015 Presidential Election – 8th Jan 2015
2004 General Elections – 2nd April 2004
2010 General Elections – 8th April 2010
2015 General Elections – 17th August 2010
2009 Provincial Council – 25th April 2009
2014 Provincial Council – 29th Mar 2014
Panadura Electoral Polling Division

Of the 7 presidential elections held Panadura polling division has voted 5 times for the SLFP/UPFA candidate, once for the UNP candidate & once for the Common Candidate in 2015.
Of the 3 General Elections held Panadura has voted twice for the UPFA in 2004 & 2010 & once for the UNP in 2015.
Of the 2 Provincial Elections held Panadura has voted for the UPFA in 2009 & 2014.
It is interesting that Panadura voted for the Common Candidate at the January 2015 Presidential election & continued to vote for the UNP at the August 2015 General Election.
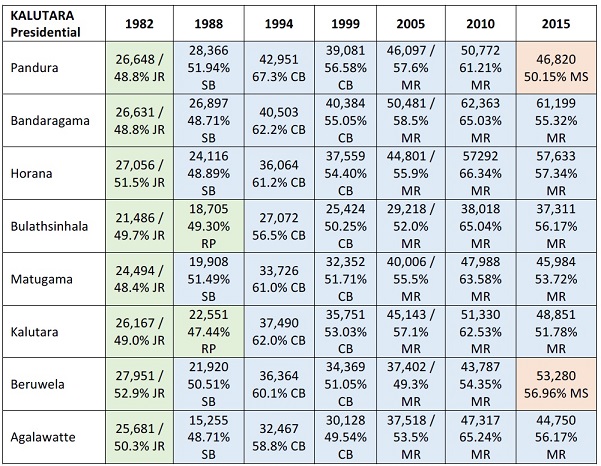
Panadura – Presidential Elections
The lowest numbers of voters went to vote in Panadura in 1988 – 22,701 voting for UNP presidential candidate JR Jayawardena.
The highest number of voters in Panadura was cast at the 2015 Presidential elections with 46,820 50.15% voting for Maithripala Sirisena.
2005 Presidential elections saw an increase in voters to 46,097 voting for Mahinda Rajapakse & further increasing to 50,772 in 2010 but Panadura voted for Maithripala Sirisena in 2015 with 46,820 voting for him. Why did the 50,772 that voted for Mahinda Rajapakse in 2010 not vote for him in 2015? At the 2015 Presidential Election Mahinda Rajapakse secured only 45,908 votes from Panadura.
UNP vote base in Panadura has increased from 26,648 in 1982 Presidential Election to 33034 in 2005 (an increase of 6386 voters in 23 years).
The 2010 & 2015 Presidential Elections fielded Common Candidates.
SLFP/UPFA vote base in Panadura has increased from 23,861 at the 1982 Presidential Election to 45,908 at the 2015 elections. (an increase of 22047 voters in 23 years)
Panadura – General Elections
2004 – 35,687 48.03% (UPFA)
2010 – 37,818 59.59% (UPFA)
2015 – 40,809 46.62% (UPFA)
The 3 General elections held in 2004, 2010, 2015 – were won by UPFA
UNP votes in Panadura has also increased from 24,020 in 2004 to 39,190 in 2015 (an increase of 15,170 votes)
UPFA votes in Panadura has increased from 35,687 in 2004 to 40,809 in 2015 (an increase of 5122 votes)
Clearly UNP vote base has been increasing though UPFA has been overall winners in Panadura district.
While UPFA will need to look into why its votebase has not increased, UNP will look to further increase its vote base in Panadura.
Panadura – Provincial Council Elections 2009 /2014
UPFA won all 8 polling divisions in Kalutara District at the 2009 & 2014 provincial council elections.
However, UPFA votes in Kalutara district have reduced from 351,215 (14 seats) in 2009 to 337,924 in 2014 (13 seats)
In Panadura polling division,
UPFA votes has reduced from 44,923 in 2009 to 37,690 in 2014
UNP votes have increased from 18,968 in 2009 to 21,558 in 2014
UNP voting pattern in Panadura
- The lowest votes UNP has received from Panadura polling division was at the 2010 General Election with only 18,022 voting for UNP.
- In the 2009 Provincial Council elections & the 2010 General Elections UNP received less than 20,000 votes from Panadura.
- The highest votes UNP has received from Panadura poling division was at the 2005 Presidential Election with 33,034 voting for Ranil Wickremasinghe
- At the 1982 Presidential Election, Panadura gave 26,648 votes to UNP this has increased to 39,190 at the 2015 General Elections (an increase of 12,542 votes)
- Noteworthy is that the UNP secured 18,022 at the 2010 General Elections which increased to 39,190 five years later at the 2015 General Elections (an increase of 21,168 votes in 5 years)
SLFP/ UPFA voting pattern in Panadura
Presidential Election in 1982 saw Panadura giving 23,861 votes to Hector Kobbekaduwa. This was also the lowest votes SLFP had received from Panadura.
From 28,366 at the 1988 Presidential Election, Panadura votes for UPFA increased to 42,951 in 1994 but reduced to 39,081 in 1999.
At the 3 general elections held in 2004, 2010 & 2015 UPFA vote base has been slowly increasing.
Whereas 37,818 voters voted for UPFA in 2010 General Elections, at the 2015 General Elections it increased to 40,809 (an increase of only 2991 votes)
However, noteworthy is that in 2010 Presidential Election Panadura gave 50,772 votes to Mahinda Rajapakse which reduced to 45,908 at the 2015 Presidentia Election. Why did 4864 voters not vote for UPFA Presidential Candidate/Mahinda Rajapakse?
With registered voters in Panadura being 114,828 (as per August 2015 General Election) there is certainly scope to increase voters.
Bandaragama Electoral Polling Division
Registered electors in Bandaragama at the 2015 General Elections were 133,887

Of the 3 General Elections held, Bandaragama has voted twice for the UNP in 2004 & 2015 & once for the UPFA in 2010.Of the 7 presidential elections held, Bandaragama polling division has voted 6 times for the SLFP/UPFA candidate & once for the UNP candidate
Of the 2 Provincial Elections held, Bandaragama has voted for the UPFA in 2009 & 2014.
Noteworthy is that in January 2015 Bandaragama voted for the UPFA Presidential Candidate but 7 months later voted for the UNP at the August 2015 General Elections. UPFA must wonder why voters lost faith in the UPFA to vote for the UNP in 2015.
Bandaragama – Presidential Elections
The lowest numbers of voters went to vote in Bandaragama in 1994 – 22,701 voting for UNP presidential candidate JR Jayawardena.
The highest number of vote in Bandaragama was cast at the 2010 Presidential elections with 62,363 65.03% voting for Mahinda Rajapakse.
UNP did not see much of a vote increase in 1982, 1988 or 1994 Presidential Elections though from 23,655 votes in 1994 UNP votes increased to 34,749 votes in 2005 Presidential elections. It reduced to 32,290 at the 2010 Presidential Elections but rose to 48,469 at the 2015 Presidential Elections for the Common Candidate.
However, Bandagarama votes for Sarath Fonseka as Common Candidate was 32,290 while at the 2015 Presidential Elections, Common Candidate Maithripala Sirisena received 48,469 votes.
SLFP/UPFA has seen a steady increase in voters from 1982 to 2015 (increasing from 25,500 in 1982 to 61,199 in 2015)
With registered voters in Bandaragama being 133,887 there is scope to increase votes.
Bandaragama – General Elections
2004 – 41,850 53.38% (UPFA)
2010 – 44,927 64.06% (UPFA)
2015 – 53,314 51.91% (UPFA)
The 3 General elections held in 2004, 2010, 2015 – were won by UPFA
UNP votes in Bandaragama reduced from 27,240 in 2004 General Elections to 19,017 in 2010 General Elections but increased to 42,069 at the 2015 General Elections.
UNP has seen a 14,829 voter increase from 2004 to 2015 (11 years).
UPFA votes in Bandaragama increased from 41,850 in 2004 to 53,314 in 2015 General Elections.
UPFA has seen a 11,464 voter increase from 2004 to 2015 (11 years)
Bandaragama – Provincial Council Elections 2009 /2014
UPFA votes has reduced from 55,404 in 2009 to 54,019 in 2014
UNP votes have reduced from 17,148 in 2009 to 16,087 in 2014
UNP voting pattern in Panadura
At the Presidential elections held in Bandaragama UNP has seen a steady increase from 1982 obtaining 26,631 votes to 2005 obtaining 34,749 votes (an increase of 8118 votes)
At the General Elections in Bandaragama, UNP has also seen a steady increase from 27,240 in 2004 to 42,069 in 2015 (an increase of 14,829 votes)
However at the Provincial Council elections UNP votes have reduced from 17,148 to 16,087 in 2014.
SLFP/ UPFA voting pattern in Bandaragama
Of the 7 Presidential Elections held UPFA has won 6.
SLFP/UPFA votes have seen an increase from 25,500 at the first Presidential Election in 1982 to 61,199 in 2015 (an increase of 35,699 voters)
There has been a slight reduction in votes from the 2010 Presidential Election to the 2015 Presidential Election with 1,164 voters voting less than they did in 2010. It would be good to survey why.
SLFP/UPFA votes have increased at the 3 General Elections held in 2004, 2010 & 2015 from 41,850 to 44,927 to 53,314.
However, SLFP/UPFA votes at the 2 Provincial Council elections in 2009 & 2014 has seen a slight reduction from 55,404 in 2009 to 54,019 in 2014.
Registered voters in Bandaragama stood at 133,887 in 2015.

At the 3 General Elections held, Horana has voted for the UPFA (2004, 2010, 2015)Of the 7 presidential elections held, Horana polling division has voted 6 times for the SLFP/UPFA candidate & once for the UNP candidate
Of the 2 Provincial Elections held, Horana has voted for the UPFA in 2009 & 2014.
Noteworthy is that apart from voting for the UNP in 1982 Presidential Elections, Horana has voted for the SLFP/UPFA at every election held since 1988.
Horana – Presidential Elections
UNP has secured less than 28,000 votes at the 4 Presidential elections held from 1982 to 1999. But in 2005 Presidential Election, Horana gave 34,300 votes to the UNP Presidential candidate. However at the 2010 Presidential election the Common Candidate received only 27,818 votes. But at the 2015 Presidential Election the Common Candidate Sirisena received 42,065 votes (an increase of 14,247 votes.
The UPFA votes have been increasing from 1982 Presidential Elections to 2015 rising from 23,518 to 57,633 (an increase of 34,115 votes)
With Horana registered voters being 122,511 there is potential to increase this margin.
Horana – General Elections
2004 – 38,421 52.87% (UPFA)
2010 – 44,136 67.61% (UPFA)
2015 – 50,024 54.26% (UPFA)
The 3 General elections held in 2004, 2010, 2015 – were won by UPFA
UNP votes in Horana reduced from 26,764 in 2004 General Elections to 16,613 in 2010 General Elections but increased to 36,325 at the 2015 General Elections.
UNP has seen a 9561 voter increase from 2004 to 2015 (11 years).
UPFA votes in Horana increased from 38,421 in 2004 to 50,024 in 2015 General Elections.
UPFA has seen a 11,603 voter increase from 2004 to 2015 (11 years)
Horana – Provincial Council Elections 2009 /2014
UPFA has won the Horana Provincial Council elections held in 2009 & 2014.
UPFA votes has reduced from 51,919 in 2009 to 44,988 in 2014
UNP votes have increased from 14897 in 2009 to 14,948 in 2014
UNP voting pattern in Horana
UNP has secured above 30,000 votes at the 2005 Presidential, 2015 Presidential & 2015 General Elections.
UNP’s performance at the previous presidential elections have been less than 28,000 votes.
While UNP secured only 16,613 at the 2010 General Elections at the 2015 General Elections UNP secured 36,325 votes (an increase of 19,712 votes. However it is noteworthy that UNP gained only 14,948 votes at the Provincial Council elections held in March 2014. Within 15months UNP has managed to increase its votes by 21,377
SLFP/ UPFA voting pattern in Horana
SLFP/UPFA votes have increased from 23,518 in 1982 Presidential elections to 57,292 Presidential Elections in 2010 (an increase of 33,774 voters)
UPFA should be concerned that the 57,292 secured at the January 2010 Presidential Elections reduced to 44,136 votes at the April 2010 General Elections. Why did 13,156 decide not to vote for UPFA from Jan-April 2010? What made them change their mind in just 4 months? Noteworthy is that from the April 2010 General Election to the 2014 Provincial Council elections, UPFA managed to increase their votebase by just 852 votes to 44,988.
Nevertheless, Horana backed Mahinda Rajapakse at the January 2015 Presidential Election giving him 57,633 votes. However, that dropped to 50,024 at the August 2015 General Elections. UPFA will need to re-assess the Horana polling division & wonder why 7609 voters decided not to vote for the UPFA 7 months after voting for its Presidential candidate in 2015 January? UPFA certainly need to win back these lost voters.

Bulathsinhala – Presidential Elections (1982, 1988, 1994, 1999, 2005, 2010, 2015)
Bulathsinhala voted for UNP at the 1982 & 1988 Presidential elections though in 1988 the UNP voter turnout reduced from 21,486 in 1982 to 18,705 in 1988. From 1994 UNP vote base in Bulathsinhala increased from 20,094 to 25,918 in 2005 but reduced to 19,073 at the 2010 Presidential Election when Common Candidate Sarath Fonseka contested.
Bulathsinhala voted for Chandrika Bandaranaike in 1994 & 1999. Voters reduced from 27,072 in 1994 to 25,424 in 1999
Bulathsinhala voted for Mahinda Rajapakse in 2005, 2010 & 2015.
Mahinda Rajapakse received 37,311 votes in 2015 – 707 votes less than he got in 2010. It would be good to ascertain why voters reduced from 38,018 in 2010 to 37,311 in 2015 for Mahinda Rajapakse.
The common candidate Sirisena received 28341 votes in 2015. In 2010 the Common Candidate Fonseka received only 19,073.
With 82,123 registered voters (2015) there is plenty of scope to increase the numbers.
Bulathsinhala – General Elections 2004/2010/2015
2004 – 25,374 49.77% (UPFA)
2010 – 29,522 68.51% (UPFA)
2015 – 31,612 52.24% (UPFA)
The 3 General elections held in 2004, 2010, 2015 – UPFA has won all 3.
UNP vote base has increased from 22,767 in 2004 to 26,254 in 2015 (an increase of 3487 votes)
UPFA vote base increased from 25,374 in 2004 to 31,612 in 2015. (an increase of 6238 votes)
Bulathsinhala – Provincial Council Elections 2009/2014
UPFA won all 8 polling divisions in Kalutara District at the 2009 & 2014 provincial council elections.
UPFA votes have reduced from 33,317 in 2009 to 33,226 in 2014
UNP votes have increased from 11,069 in 2009 to 11,357 in 2014
Bulathsinhala registered voters are 81,045

Matugama – Presidential ElectionsMatugama registered voters has increased from 61,809 in 1982 to 108,996 voters in 2015 (an increase of 47187 voters)
Matugama has voted only once in 1982 for the UNP Presidential candidate.
All 6 Presidential elections have been won by the SLFP/UPFA candidate.
A steady increase in UPFA vote base is seen.
From 19,908 in 1988, to 33,726 in 1994, to 32,352 in 1999, to 40,006 in 2005, to 47,988 in 2010 to 45,984 in 2015.
As can been seen Mahinda Rajapakse’s vote base has reduced by 2004 votes from the 2010 to 2015 election.
UNP votes in Matugama has seen increase-decrease structure with 1988 results less than 1982, 2010 results less than 2005 but a sudden increase from 26,016 in 2010 to 38,668 in 2015. Matugama votes for Common Candidate Sarath Fonseka has been less than its votes for Common Candidate Maithripala Sirisena in 2015 with 38,668 votes.

Kalutara – Presidential Elections
The highest percentage of voters cast their votes in 2010 with 62.53% voting for Mahinda Rajapakse.
Kalutara has voted for UNP twice at the Presidential Elections in 1982 & 1988.
Kalutara vote base for UPFA/SLFP has been increasing from 1988.
While 51,330 voters voted for Mahinda Rajapakse in 2010, in 2015 his vote base reduced to 48,851. Why did 2479 voters decide not to vote for Mahinda Rajapakse in 2015?
Registered voters have increased from 64,944 in 1982 to 117,931 in 2015. An increase of 52987 voters.
Kalutara – General Elections
2004 – 37,958 52.10% (UPFA)
2010 – 38,300 62.77% (UPFA)
2015 – 40,837 46.78% (UPFA)
The 3 General elections held in 2004, 2010, 2015 – UPFA has won all 3.
UNP votes reduced to 16,838 at the 2010 General Elections from 26,255 at the 2004 elections & suddenly increased to 39,525 at the 2015 General Elections. The increase of 22,687 votes.
Kalutara – Provincial Council Elections 2009/2014
UPFA won all 8 polling divisions in Kalutara District at the 2009 & 2014 provincial council elections.
UPFA votes have reduced from 42,102 in 2009 to 38,777 in 2014
UNP votes have increased from 16,637 in 2009 to 21,639 in 2014
UNP voting pattern in Kalutara
Kalutara voted for UNP at both the 1982 & 1988 Presidential Elections. UNP vote base increased to 32,916 only at the 2005 Presidential Election but 4 years later at the Provincial Council elections the UNP received only 16,637 votes. This changed the following year when UNP fielded Common Candidate Sarath Fonseka with Kalutara giving 29,719 votes in January 2010. However, the same year at the General Elections in April, the UNP received just 16,838 votes. This increased to 21,639 at the 2014 Provincial elections.
At the January 2015 Presidential Elections 44,804 voters in Kalutara voted for the Common Candidate Maithripala Sirisena which reduced to 39,525 by August 2015 at the General Elections.
SLFP/UPFA voting pattern in Kalutara
Apart from the 1982 & 1988 Presidential Elections, UPFA has won all the 5 Presidential elections, 3 General Elections & 2 provincial elections being currently analysed.
UPFA votes have been increasing from 22,992 in 1982 to 45,143 at the 2005 Presidential Elections. However, UPFA votes reduced to 42,102 at the 2009 provincial council elections but increased to 51,330 at the 2010 Presidential Elections. What UPFA will seriously need to address is how 51,330 voters in January 2010 reduced to 38,300 at the April General Elections – a reduction of 13030 voters.
This increased to 48,851 at the 2015 January Presidential Elections but again reduced to 40,837 months later at the August General Elections. UPFA will need to address why its vote base is fluctuating in Kalutara in particular why it lost 8014 voters from January to August 2015?

Beruwela – Presidential Elections
The highest percentage of voters cast their votes at the 2009 Provincial Council elections with 61.52% voting for UPFA. In terms of numbers the most voted in 2010 Presidential Election with 43,787 voters from Beruwela voting for UPFA Presidential Candidate Mahinda Rajapakse.
Beruwela has voted for UNP Presidential Candidate only ONCE in 1982 while the last Presidential election Beruwela voted for the Common Candidate Maithripala Sirisena in 2015.
Beruwela vote base for UPFA/SLFP has been increasing from 1982 (22,349 voters) to 1994 (36,364voters) but saw a slight decrease to 34,369 voters in 1999 which increased to 37,402 at the 2005 Presidential Election & further increased to 43,787 at the 2010 Presidential Election.
UPFA/SLFP must wonder why its vote base decreased by 4363 voters at the 2015 Presidential Elections with only 39,424 voting for Mahinda Rajapakse whereas 53,280 voters from Beruwela voted for Maithripala Sirisena the common candidate.
UNP vote base in Beruwela fluctuating. The highest votes received was for the UNF Presidential Candidate Ranil Wickremasinghe in 2005 with 37390 but it was at the 2015 Presidential Election where 53,280 voted for Maithripala Sirisena in 2015. The 2010 Presidential Election the Common Candidate Fonseka received 35,678 votes
Beruwela – General Elections
2004 – 33,583 47.38% (UFPA)
2010 – 32,709 54.10% (UPFA)
2015 – 47,987 54.94% (UNP)
The 3 General elections held in 2004, 2010, 2015 – UPFA has won the 2004 & 2010 while the 2015 General Elections were won by the UNP led UNF.
It is noteworthy that the UPFA vote base has declined from 33,583 in 2004 to 32,709 in 2010 though it increased to 33,142 in 2015.
UNP vote base declined significantly from 30,210 in 2004 General Election to 21,737 votes at the 2010 General Elections but has seen a phenomenal increase to 47,987 at the 2015 General Elections.
Beruwela – Provincial Council Elections 2009/2014
UPFA won all 8 polling divisions in Kalutara District at the 2009 & 2014 provincial council elections.
UPFA votes have increased from 38,980 in 2009 to 39,715 votes in 2014 (an increase of just 735 votes)
UNP votes have increased from 14,253 in 2009 to 24,615 in 2014 an increase of 10,362 votes
With 114,791 registered voters as per 2014 elections department there is scope to increase

The highest percentage of voters cast their votes in 2010 with 65.24% voting for the UPFA Presidential Candidate Mahinda Rajapakse.Agalawatte – Presidential Elections
In terms of numbers the most voted also in 2010 with 47,317 voting for Mahinda Rajapakse.
Agalawatte has voted for UNP only at the 1982 Presidential Elections.
Agalawatte vote base for UPFA/SLFP has been increasing from 1982 (21,041 voters) to 1994 (32,467 voters) but reduced to 30,128 voters in 1999 but increased to 37,518 in 2005 & further increased to 47,317 in 2010. UPFA will need to wonder why only 44,750 voted for its presidential candidate in 2015 a reduction of 2567 voters.
UNP vote base has been fluctuating in Agalawatte with lowest votes at the 1988 Presidential Elections (15,155 votes) which increased to 31,449 votes in 2005 Presidential Election but reduced to 23,717 votes in 2010 for the Common Candidate Fonseka. It would be interesting to find out how Agalawatte which gave 23,717 votes to the Common Candidate Fonseka gave 33,995 votes to the Common Candidate Sirisena – a difference of 10,278 votes.
Agalawatte – General Elections
2004 – 33,939 53.66% (UPFA)
2010 – 35,541 68.16% (UPFA)
2015 – 38,125 51.85% (UPFA)
The 3 General elections held in 2004, 2010, 2015 – UPFA has all 3 polling divisions. However, it is noteworthy that the UPFA vote base increased from 2009 to 2015 (33939 in 2009 / 35,541 in 2010 & 38,125 in 2015)
Agalawatte – Provincial Council Elections 2009/2014
UPFA won all 8 polling divisions in Kalutara District at the 2009 & 2014 provincial council elections.
UPFA votes have increased from 37,558 71.03% in 2009 to 39,488 65.09% in 2014
UNP votes have also increase slightly from 13,682 in 2009 to 14,840 in 2014. With 99,146 registered voters there is scope to increase

Of the 3 General Elections held in 2004, 2010 & 2015, UPFA has won all 8 polling divisions of Kalutara District except Beruwala which went to the UNP in 2015. While UPFA will need to assess its vote decline in Beruwela.
UNP voters have increased from 24,020 in 2004 to 39,190 in 2015 in Panadura, 27,240 in 2004 to 42,069 in 2015 in Bandaragama, 26,764 in 2004 to 36,325 in Horana, 17,295 in 2004 to 35,267 in 2015 in Matugama, 16,838 in 2010 to 39,525 in Kalutara , 21,737 in 2010 to 47,987 in 2015 in Beruwela which UNP won and 14,402 in 2010 in Agalawatte to 31,731 in 2015. These increases are in bigger numbers to the increases in UPFA vote base.

UPFA has won 83 timesThus, of the 96 times elections have been held from 1982 to 2015 (33 years) in Kalutara District
UNP has won 11 times
Common Candidate has won 2 times
The above graph depicts the election victories of the 7 Presidential Elections, 3 General Elections & 2 Provincial Council elections. As can be seen apart from winning all 8 polling divisions at the 1982 Presidential Elections, the UNP voters in Kalutara district has voted for UNP only in Bulathsinhala & Kalutara at the 1988 Presidential elections & Beruwela at the 2015 General Electionss. However, UNP vote base is increasing inspite of UNP not winning polling divisions.
At the 2015 General Election registered voters were 897,349 with 760,365 going to vote.
Shenali D Waduge